Centromere calling on the duan et al yeast data
This small example shows how to perform a quick centromere call on the first 5 chromosomes of Duan et al yeast data.
import numpy as np
from centurion.externals import iced
from centurion import centromeres_calls
import matplotlib.pyplot as plt
from matplotlib import colors
Firt load the sample data available in the iced package. The data consists of the first five chromosomes of the budding yeast.
counts, lengths = iced.datasets.load_sample_yeast()
Then apply centurion’s centromere calling algorithm. This yields the estimated position of centromeres. The counts argument is a numpy array containing the contact counts. The lengths is a 1D numpy vector containing the number of bins associated to each chromosomes. As such, the shape of counts ndarray should match the sum of the lengths vector. In addition, we provide the resolution of the data. Here, the data provided is at 10kb.
centromeres = centromeres_calls.centromeres_calls(
    counts, lengths,
    resolution=10000)
Normalize the data for the sake of visualization
counts = iced.filter.filter_low_counts(counts, percentage=0.04)
counts = iced.normalization.ICE_normalization(counts)
And remove the intra chromosomal for the sake of visualization
mask = iced.utils.get_intra_mask(lengths)
counts[mask] = np.nan
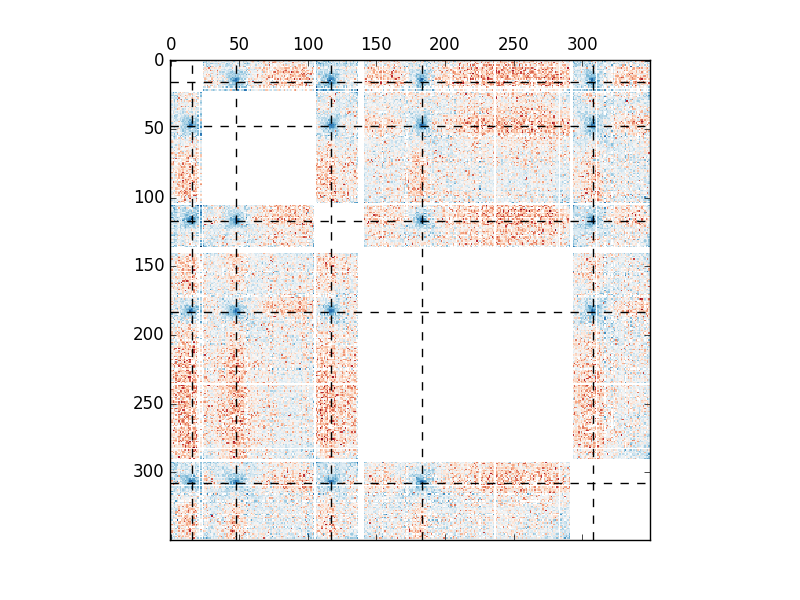
In order to visualize the position of centromeres, we need to map the centromeres’ position to the position in the ndarray.
centro = centromeres / 10000
centro[1:] += lengths.cumsum()[:-1]

fig, ax = plt.subplots()
ax.matshow(counts, cmap="RdBu", norm=colors.LogNorm())
[ax.axhline(i, color="#000000", linestyle="--") for i in centro]
[ax.axvline(i, color="#000000", linestyle="--") for i in centro]
Total running time of the script: ( 0 minutes 5.841 seconds)